February Tip of The Month - 12 lead interpretation Week 4 RESULTS
ALL the ECGs presented this week have a final diagnosis of Pulmonary Embolism (PE)!
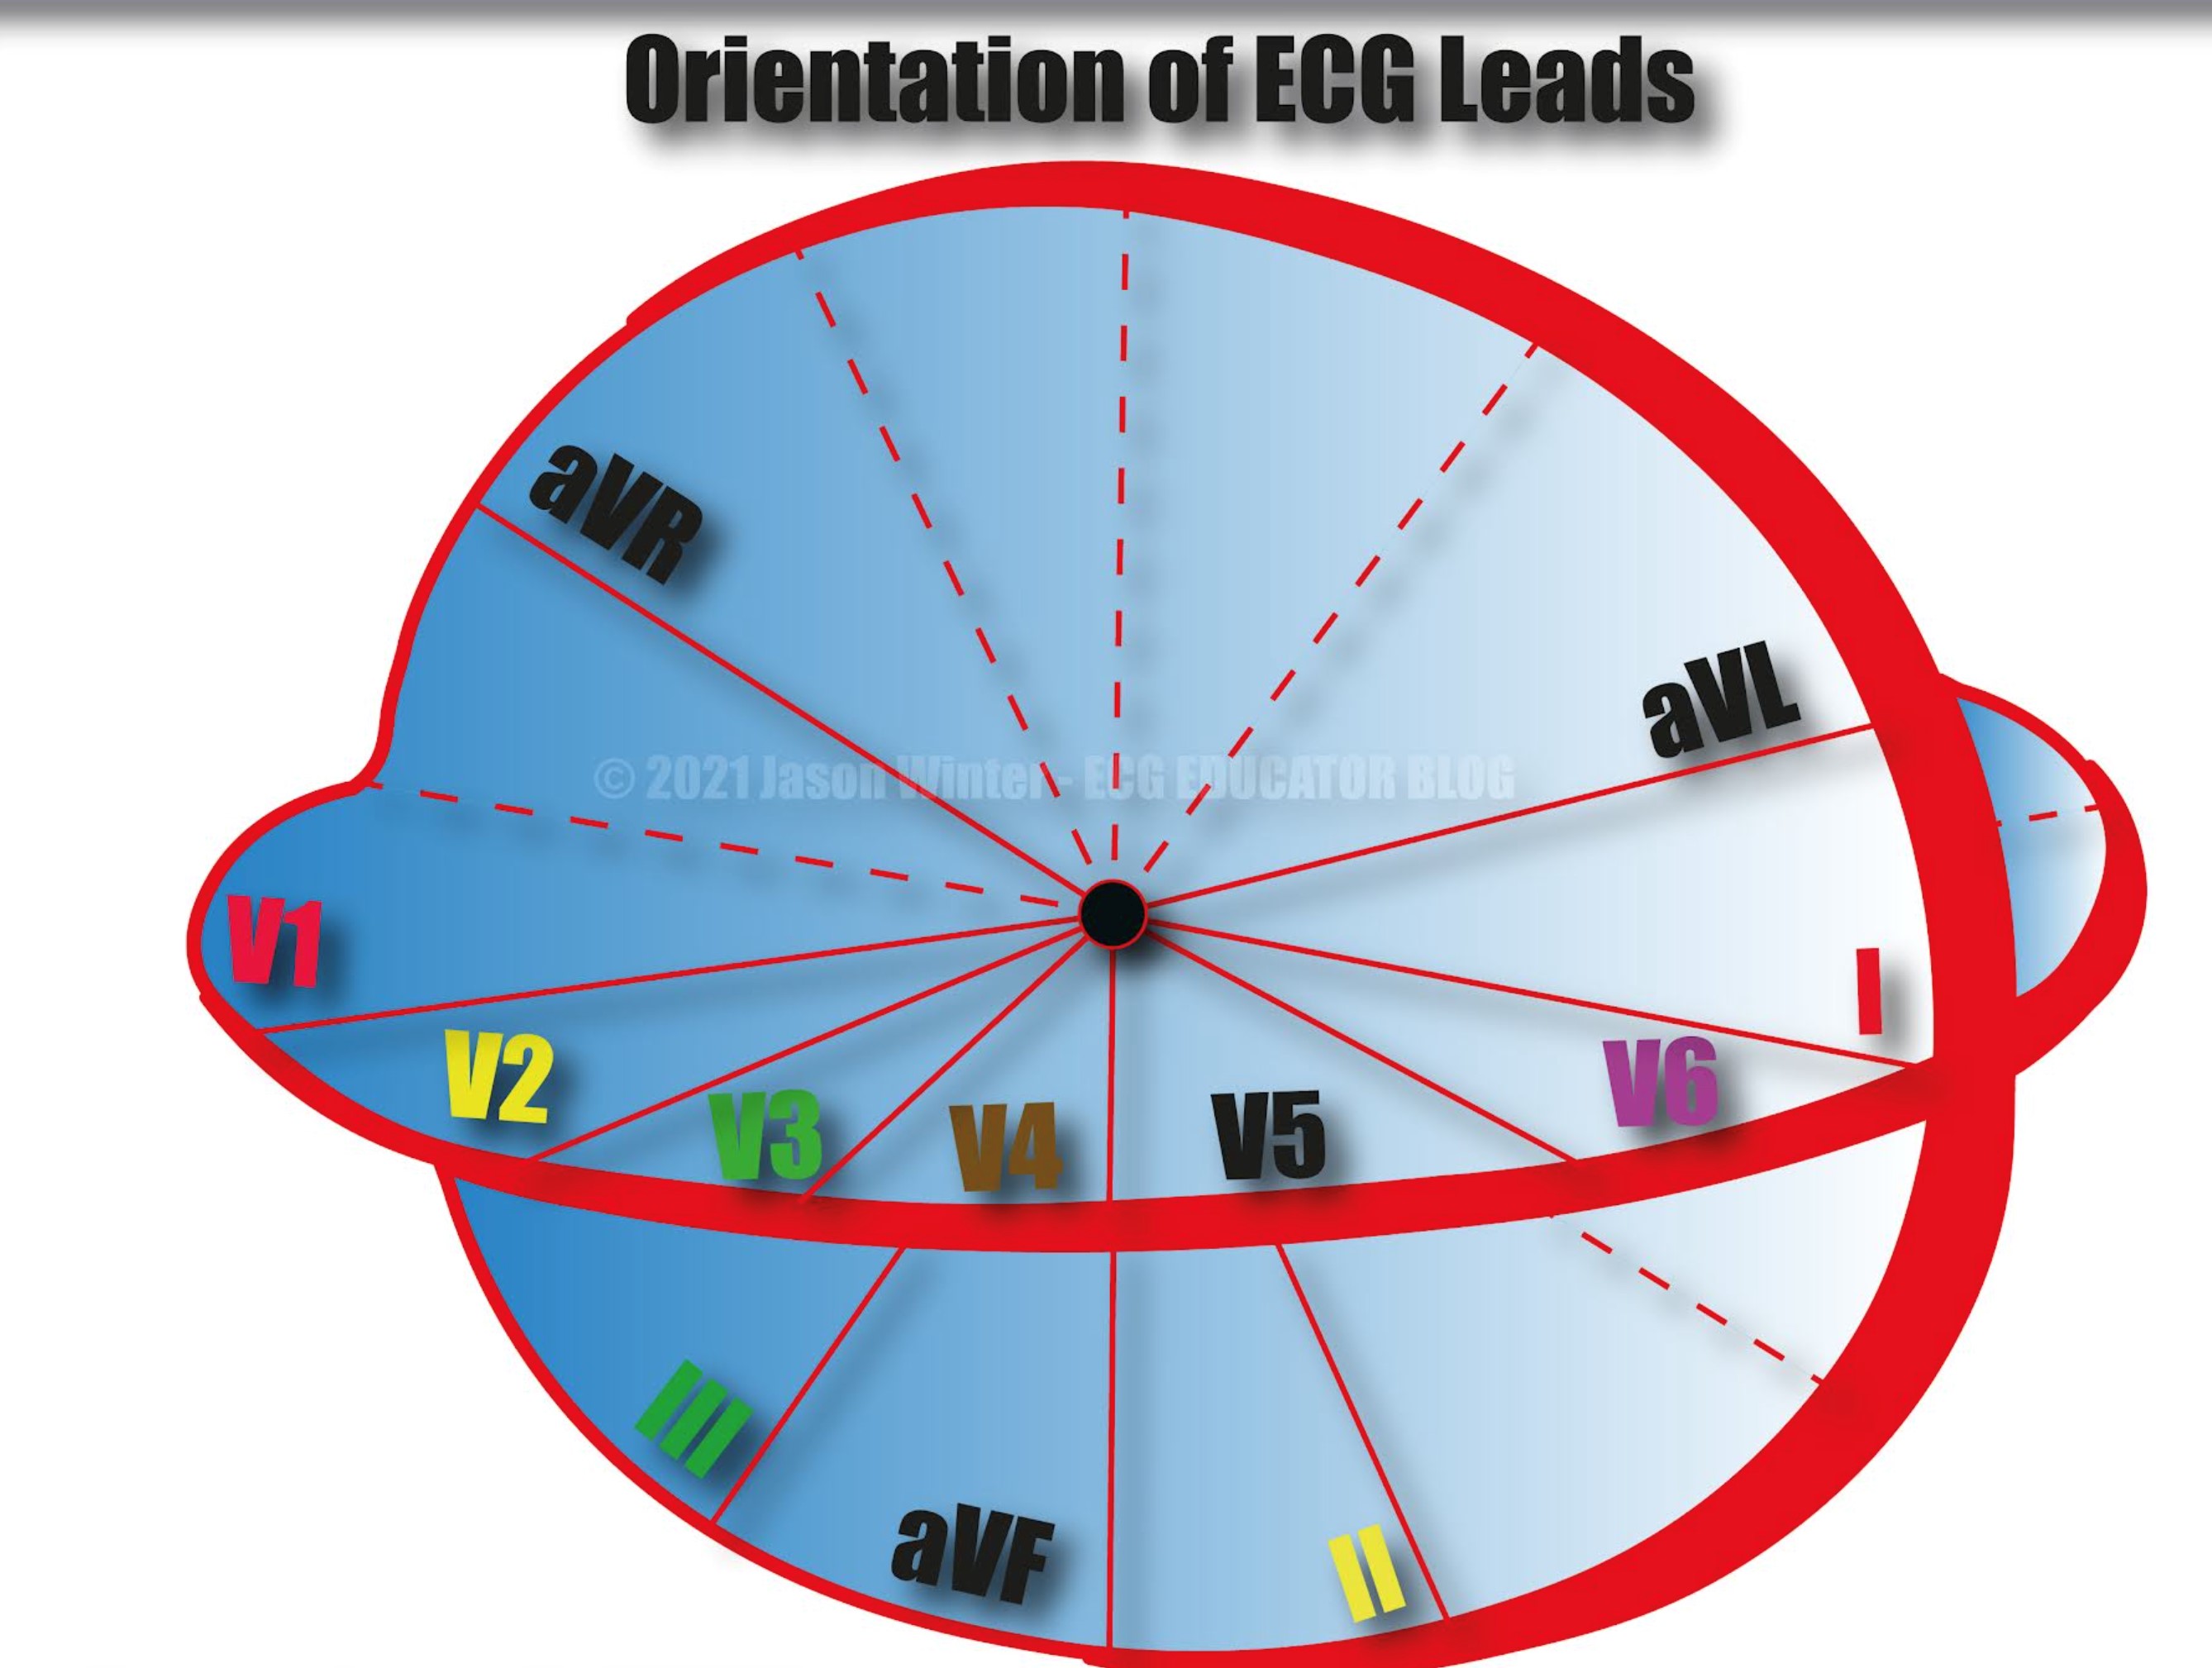
Before we begin the review, take a moment and refresh yourself as to where the various leads are with respect to the anatomical location of the heart. I specifically want you to notice that aVR, V1, and lead III are on the right side of the heart.
ECG findings in Pulmonary Embolism
- Sinus Tachycardia
- You don’t need tachycardia to have a PE. Tachycardia is seen in only ~30% of patients, but signals increased oxygen demand
- Atrial and ventricular dysrhythmias
- SVT, atrial fibrillation, atrial flutter, etc.
- SVTs (AVNRT, AVRT, atrial and junctional tachycardias, etc.) are an independent predictor of subsequent clinical deterioration
- ECG Signs of RV strain
- Rightward axis (look for large S wave in lead I)
- S1Q3or S1Q3T3(not sensitive or specific)
- Conduction delays and repolarization abnormalities
- New RBBB or incomplete RBBB
- Look for tall R waves in V1
- New T-wave inversions
- Right precordial leads (V1-V4)
- Inferior leads (II, III, aVF)
- New T wave inversions in the anteroseptal leads +/- inferior leads should be considered a sign of acute pulmonary hypertension or PE until proven otherwise
- ST-segment elevations or depressions (mimics ischemia)
- ST-segment elevation in rightward leads (V1, V2, aVR, III)
- Rightward axis (look for large S wave in lead I)
- Co, et al. J Emerg Med 2017 (PMID: 27742402) – identified the most common ECG changes in patients with known PE when comparing their ECGs with previous ECGs
- 285 PEs diagnosed on CTA (62% segmental, 20% in main pulmonary artery, 8% saddle)
- No ECG changes ~ 24%
- T wave inversion ~ 34%
- T wave flattening ~ 30%
- Sinus tachycardia ~ 27%
- Rightward axis ~ 11%
- ST segment changes ~ 9%
- S1Q3T3~ 4%
- 285 PEs diagnosed on CTA (62% segmental, 20% in main pulmonary artery, 8% saddle)
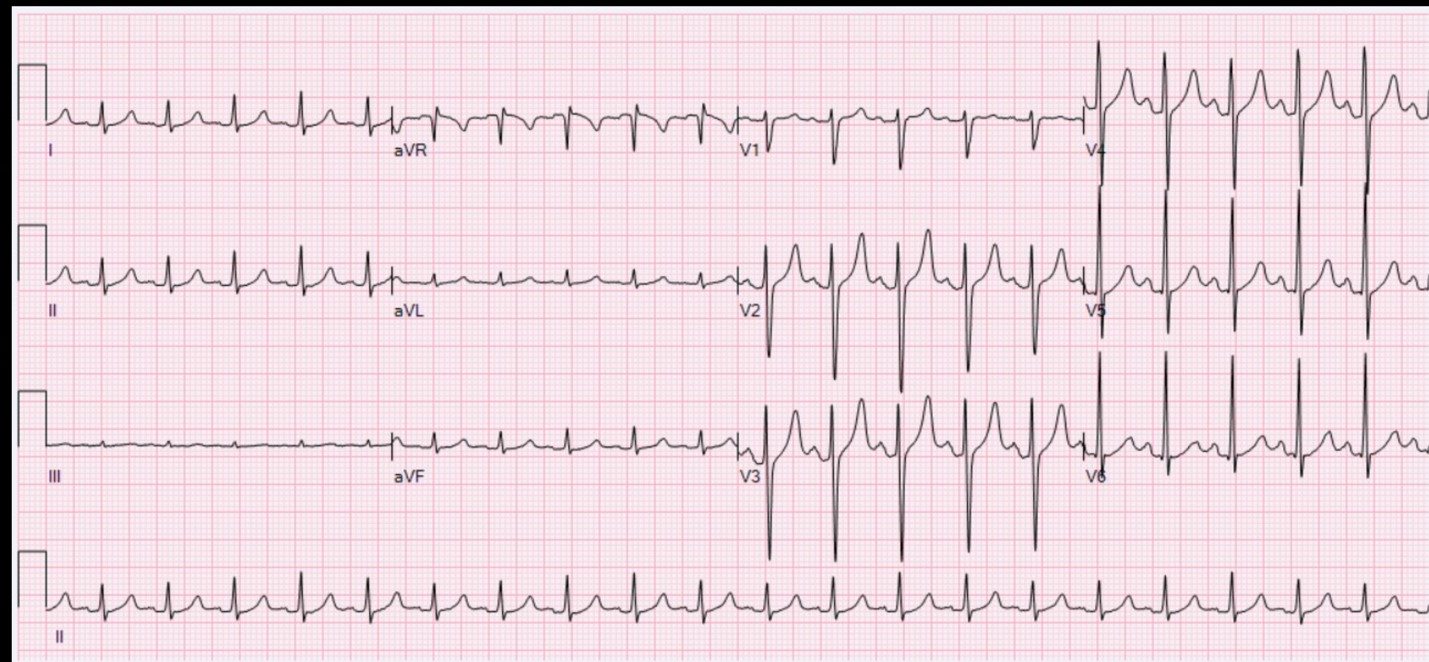
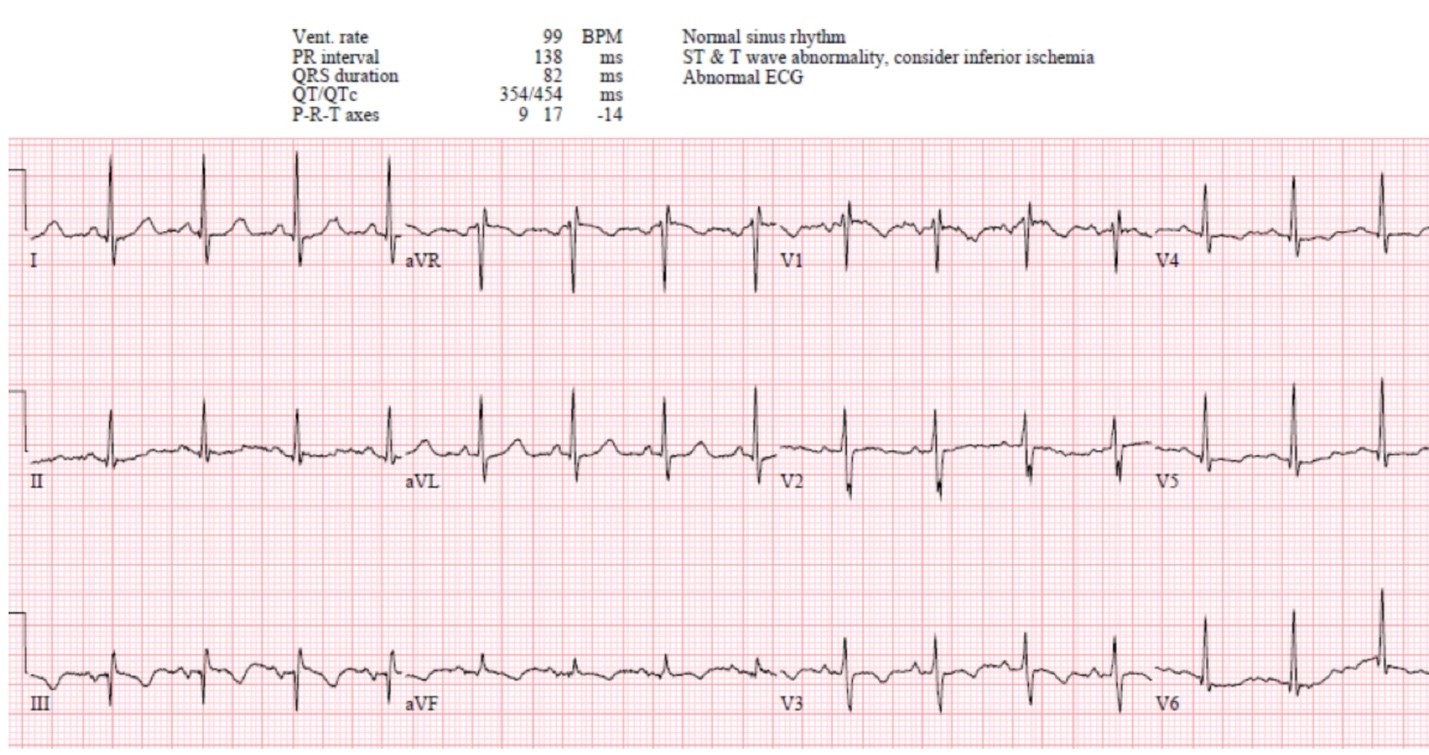
ECG 1
This shows the classic S1Q3T3 finding, which is neither sensitive nor specific per PE and present only probably about 4% of the time. More importantly, we see ST elevation in leads aVR, V1 and lead III.
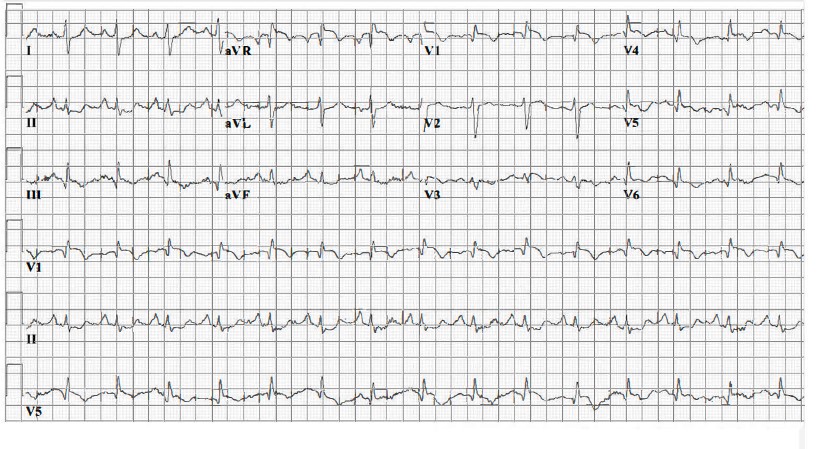
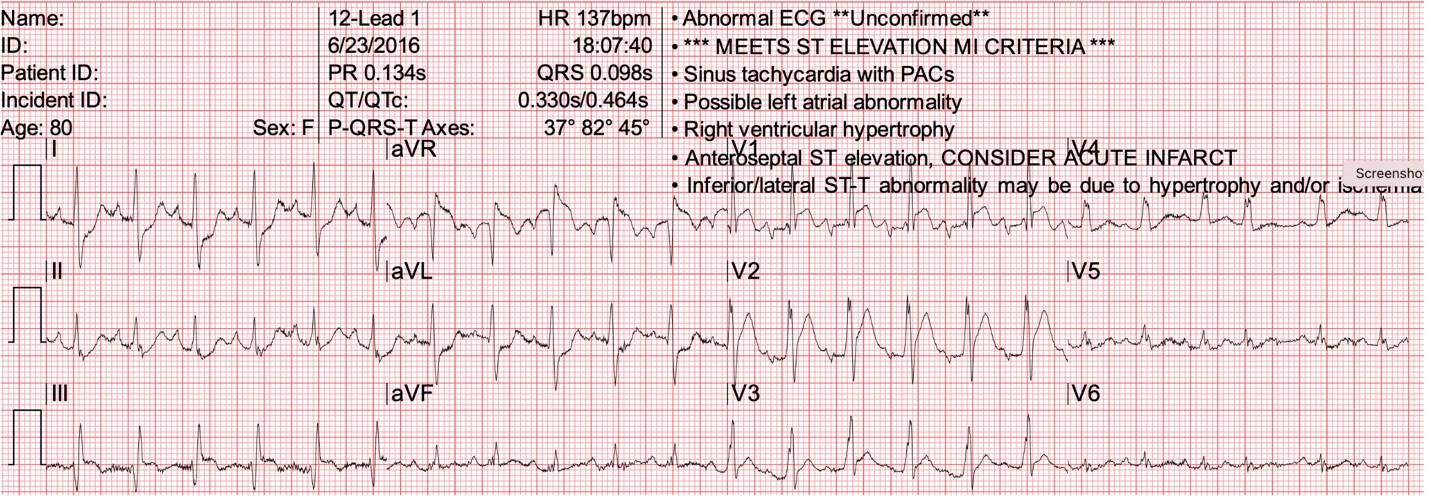
ECG 2
Here again, we see S1Q3T3. There is also STE in aVR and widespread STD. You may recall that we have mentioned this pattern before, and it can be seen with critical ACS, however, it is also seen in other conditions whereby the heart is put under stress such as sepsis, profound GI bleeding, and PE!
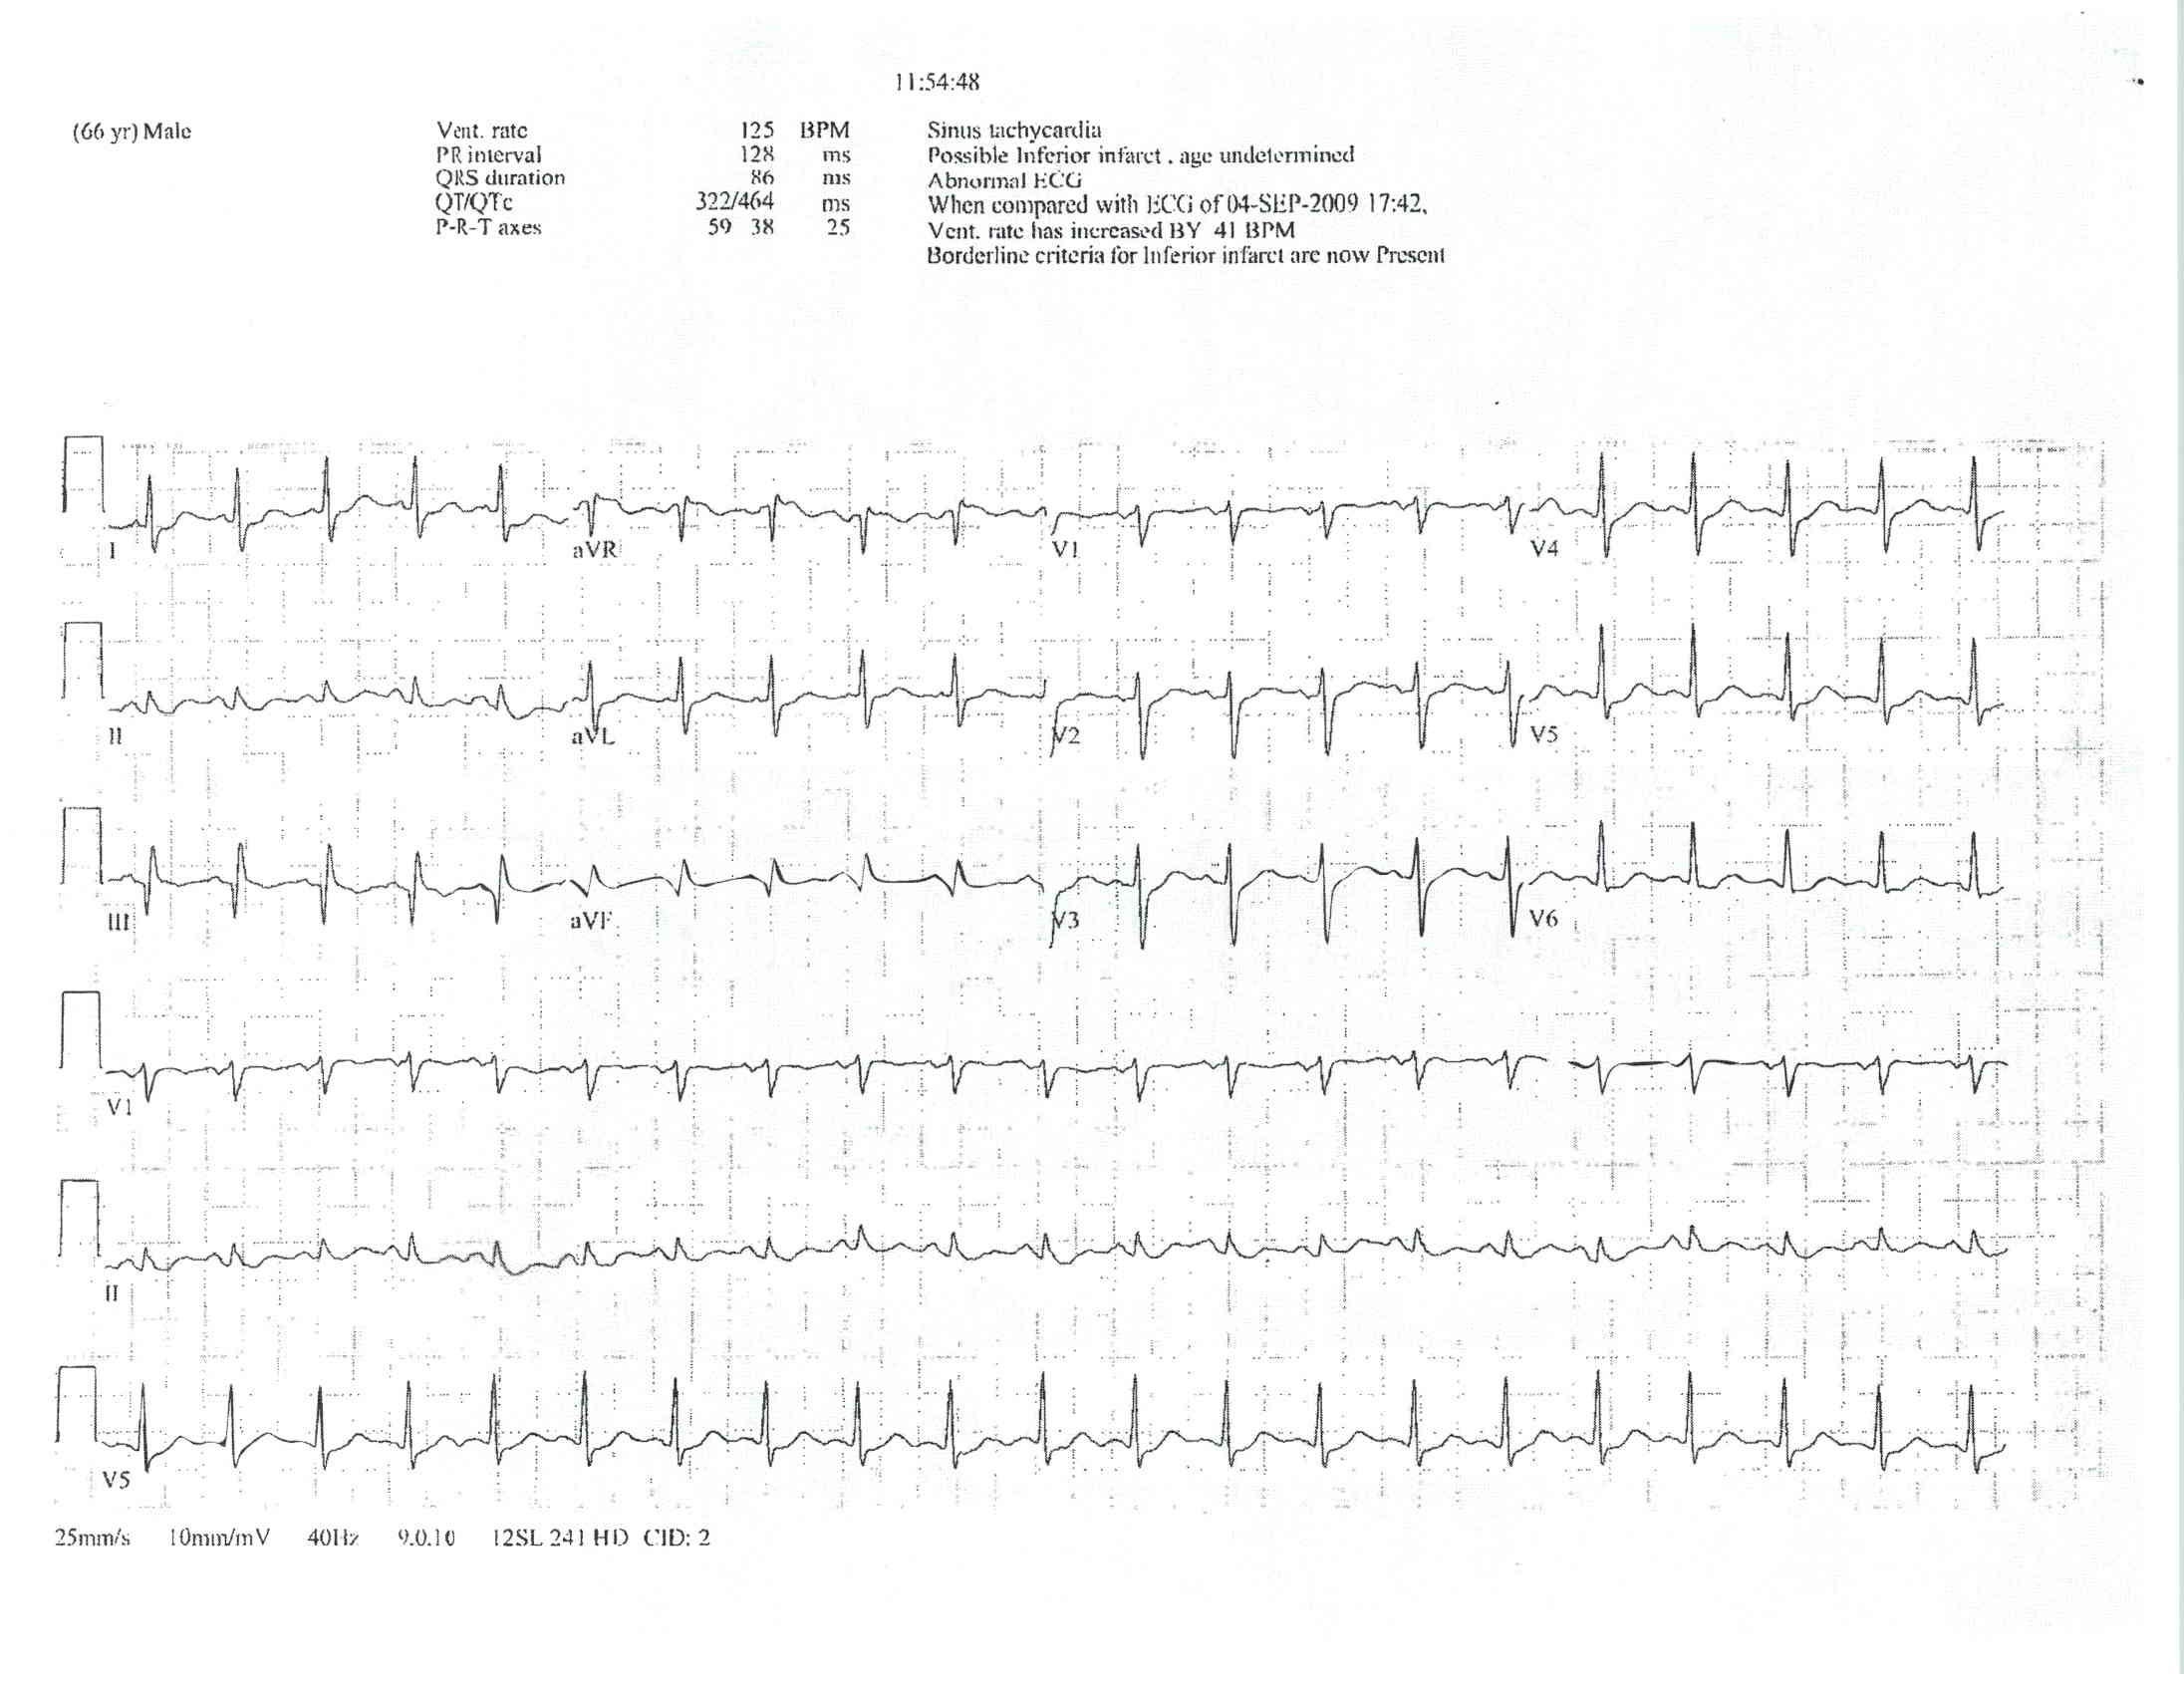
ECG 3
This ECG shows deep TWI (T wave inversion) in both anterior (V1- V4), as well as inferior leads. This is PE until ruled out!

ECG 4
Here we see an incomplete RBBB, we also see SRE in aVR, V1, and lead III. There is also T wave inversions in the precordial and inferior leads. All of these findings point towards PE as the diagnosis.
ECG 5
Here we see S1Q3T3 again, and certainly, the S wave is deep in lead 1. But also note the significant STE in aVR V1, V2 and lead III.
ECG 6
This ECG is essentially a normal sinus tachycardia with no other specific findings to suggest PE and this is often what we see.